getting historical data from MetaTrader
12 May 2021Getting historical intraday financial data can be a pain, especially for non-US markets. If you have deep pockets you can simply buy the data you need, but for retail investors the cost is prohibitive. If you want historical transaction-level data for the Brazilian stock market, for instance, TickData will sell it to you for about US$ 65000. Hard pass. What to do?
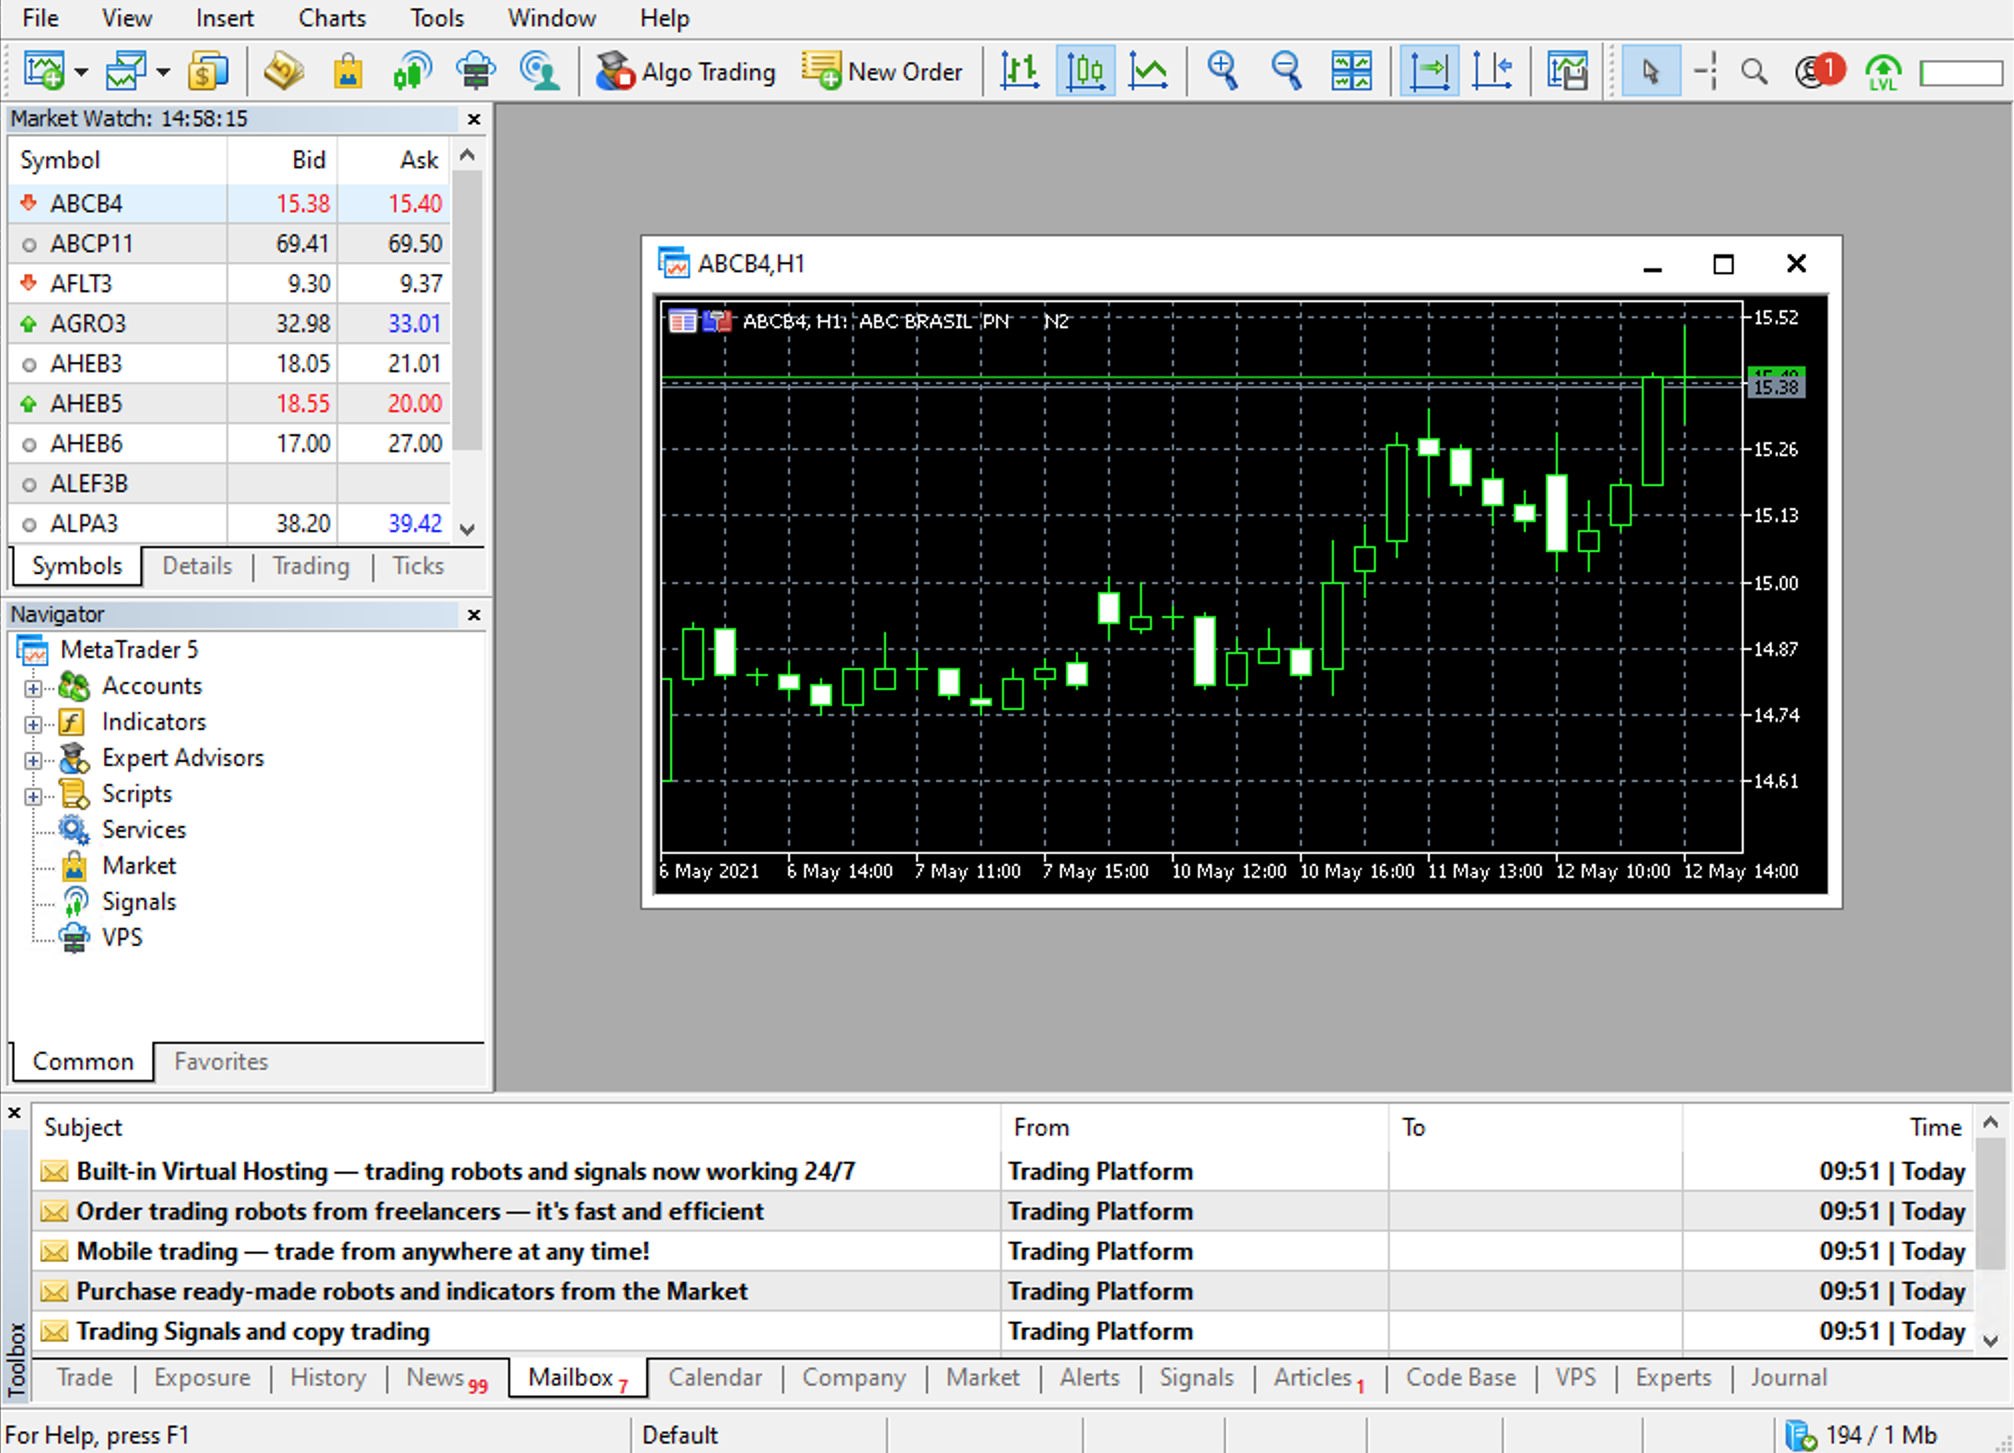
I recently learned about an app called MetaTrader. MetaTrader gives you real-time stock price charts. It is popular with people who do technical analysis - people who buy and sell equities based on certain chart patterns (like a “head and shoulder formation”, for instance). I’ve never bothered with technical analysis and I guess that’s why MetaTrader had escaped my radar until now.
The important thing is: many brokers pay MetaTrader so that their clients can access it, and MetaTrader has historical intraday data for whatever market(s) each broker operates in.
I checked and it turns out that my broker in Brazil has one such deal with MetaTrader. I got a username and password, downloaded the app, and started exploring.
If you’re only interested in a couple of equities you can export the data manually. Go to the View menu and click Symbols.
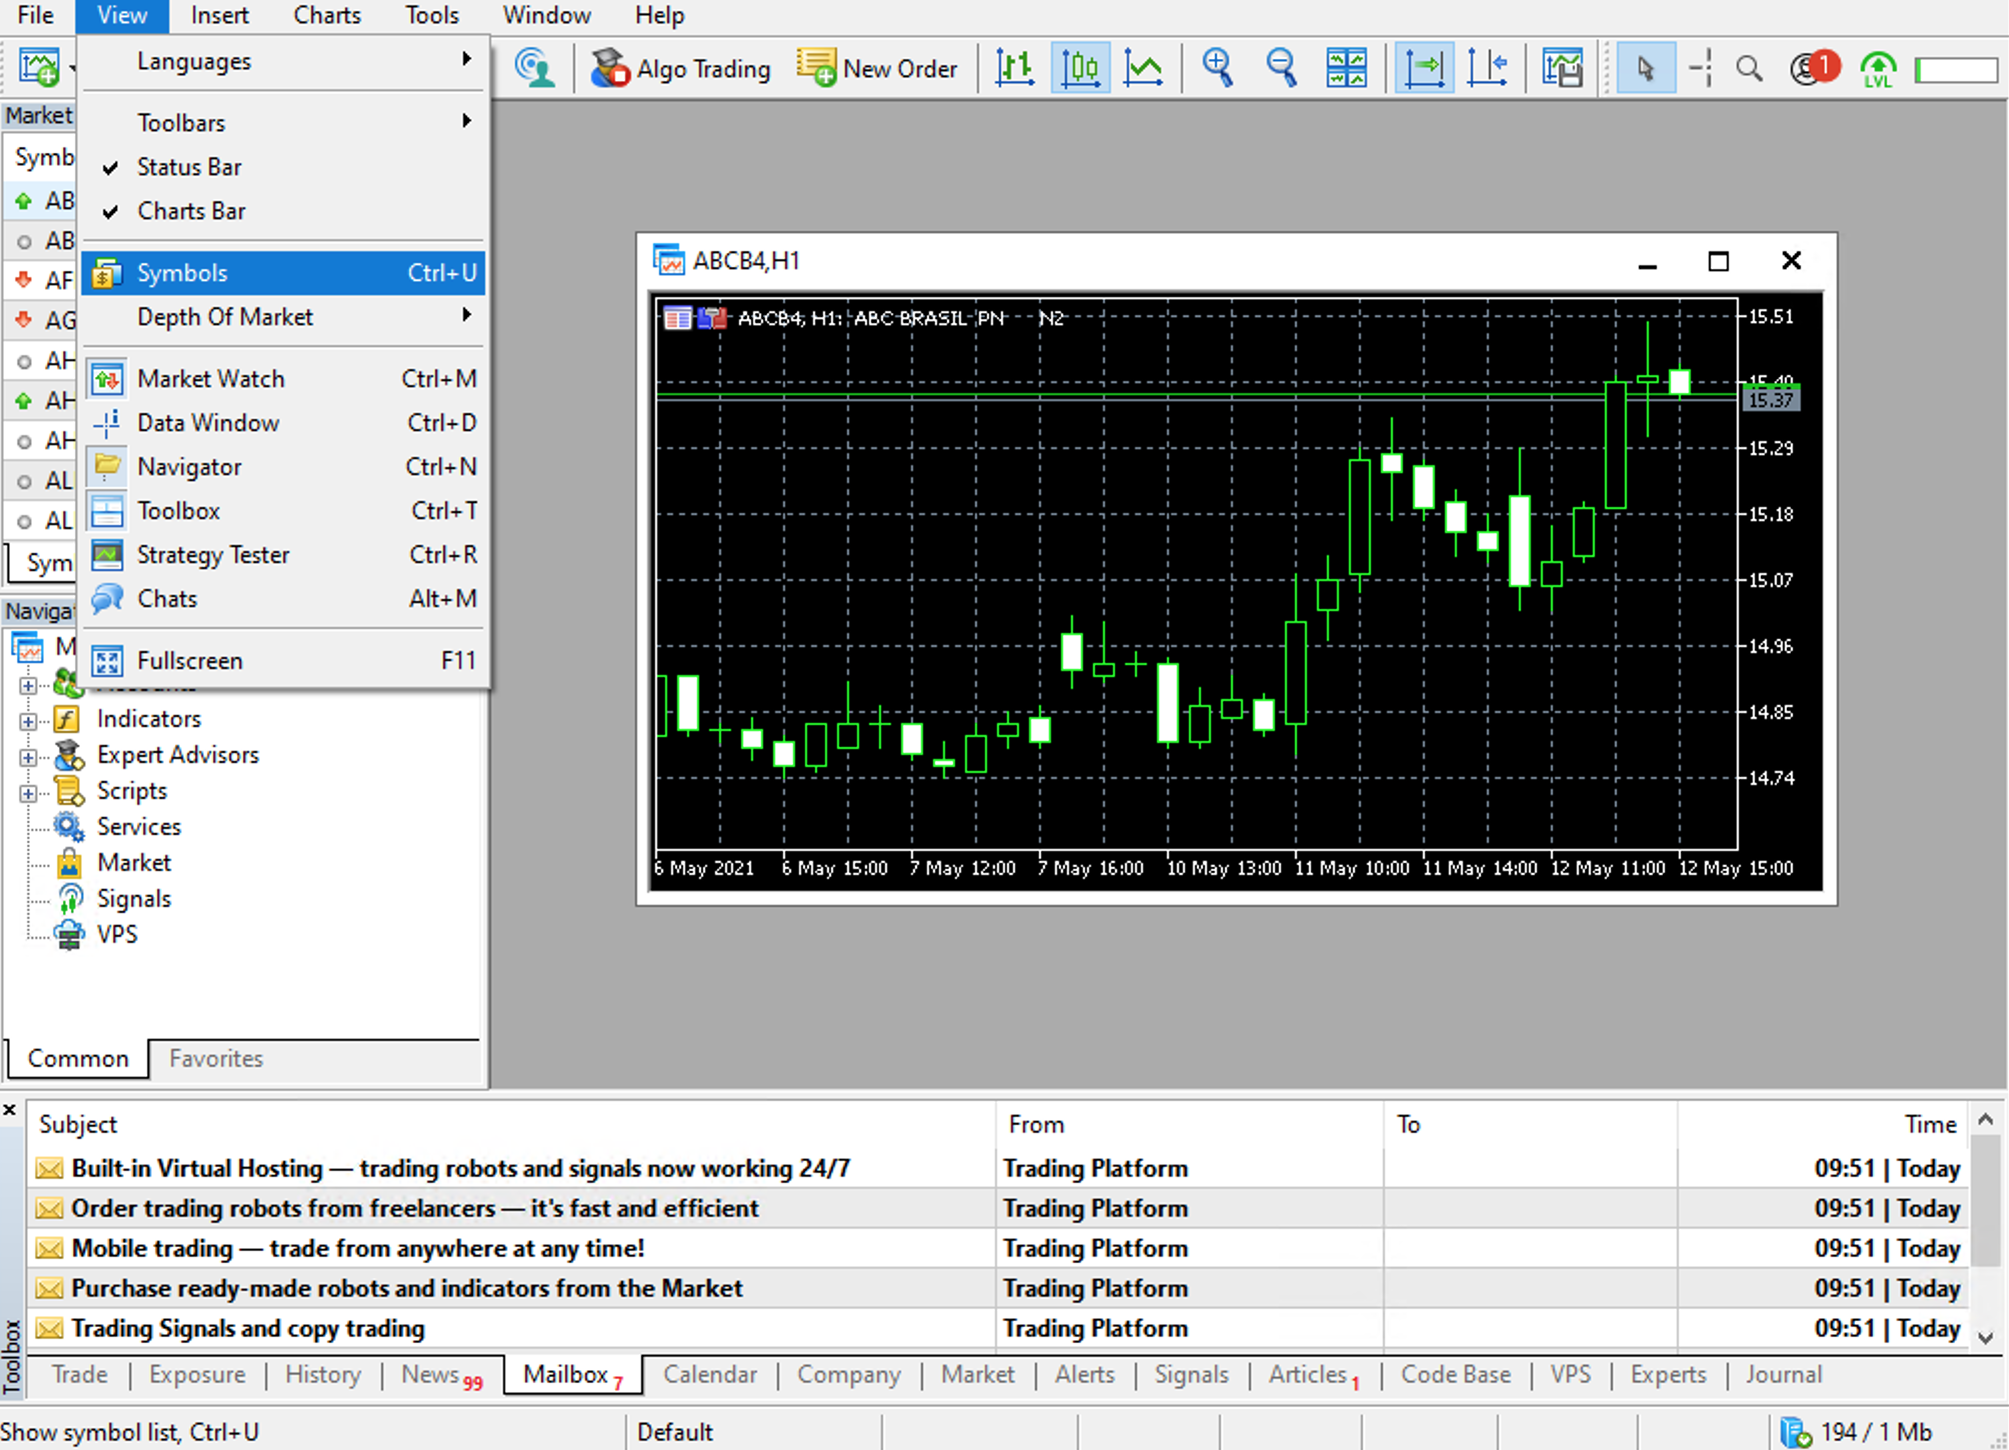
A new window will open:
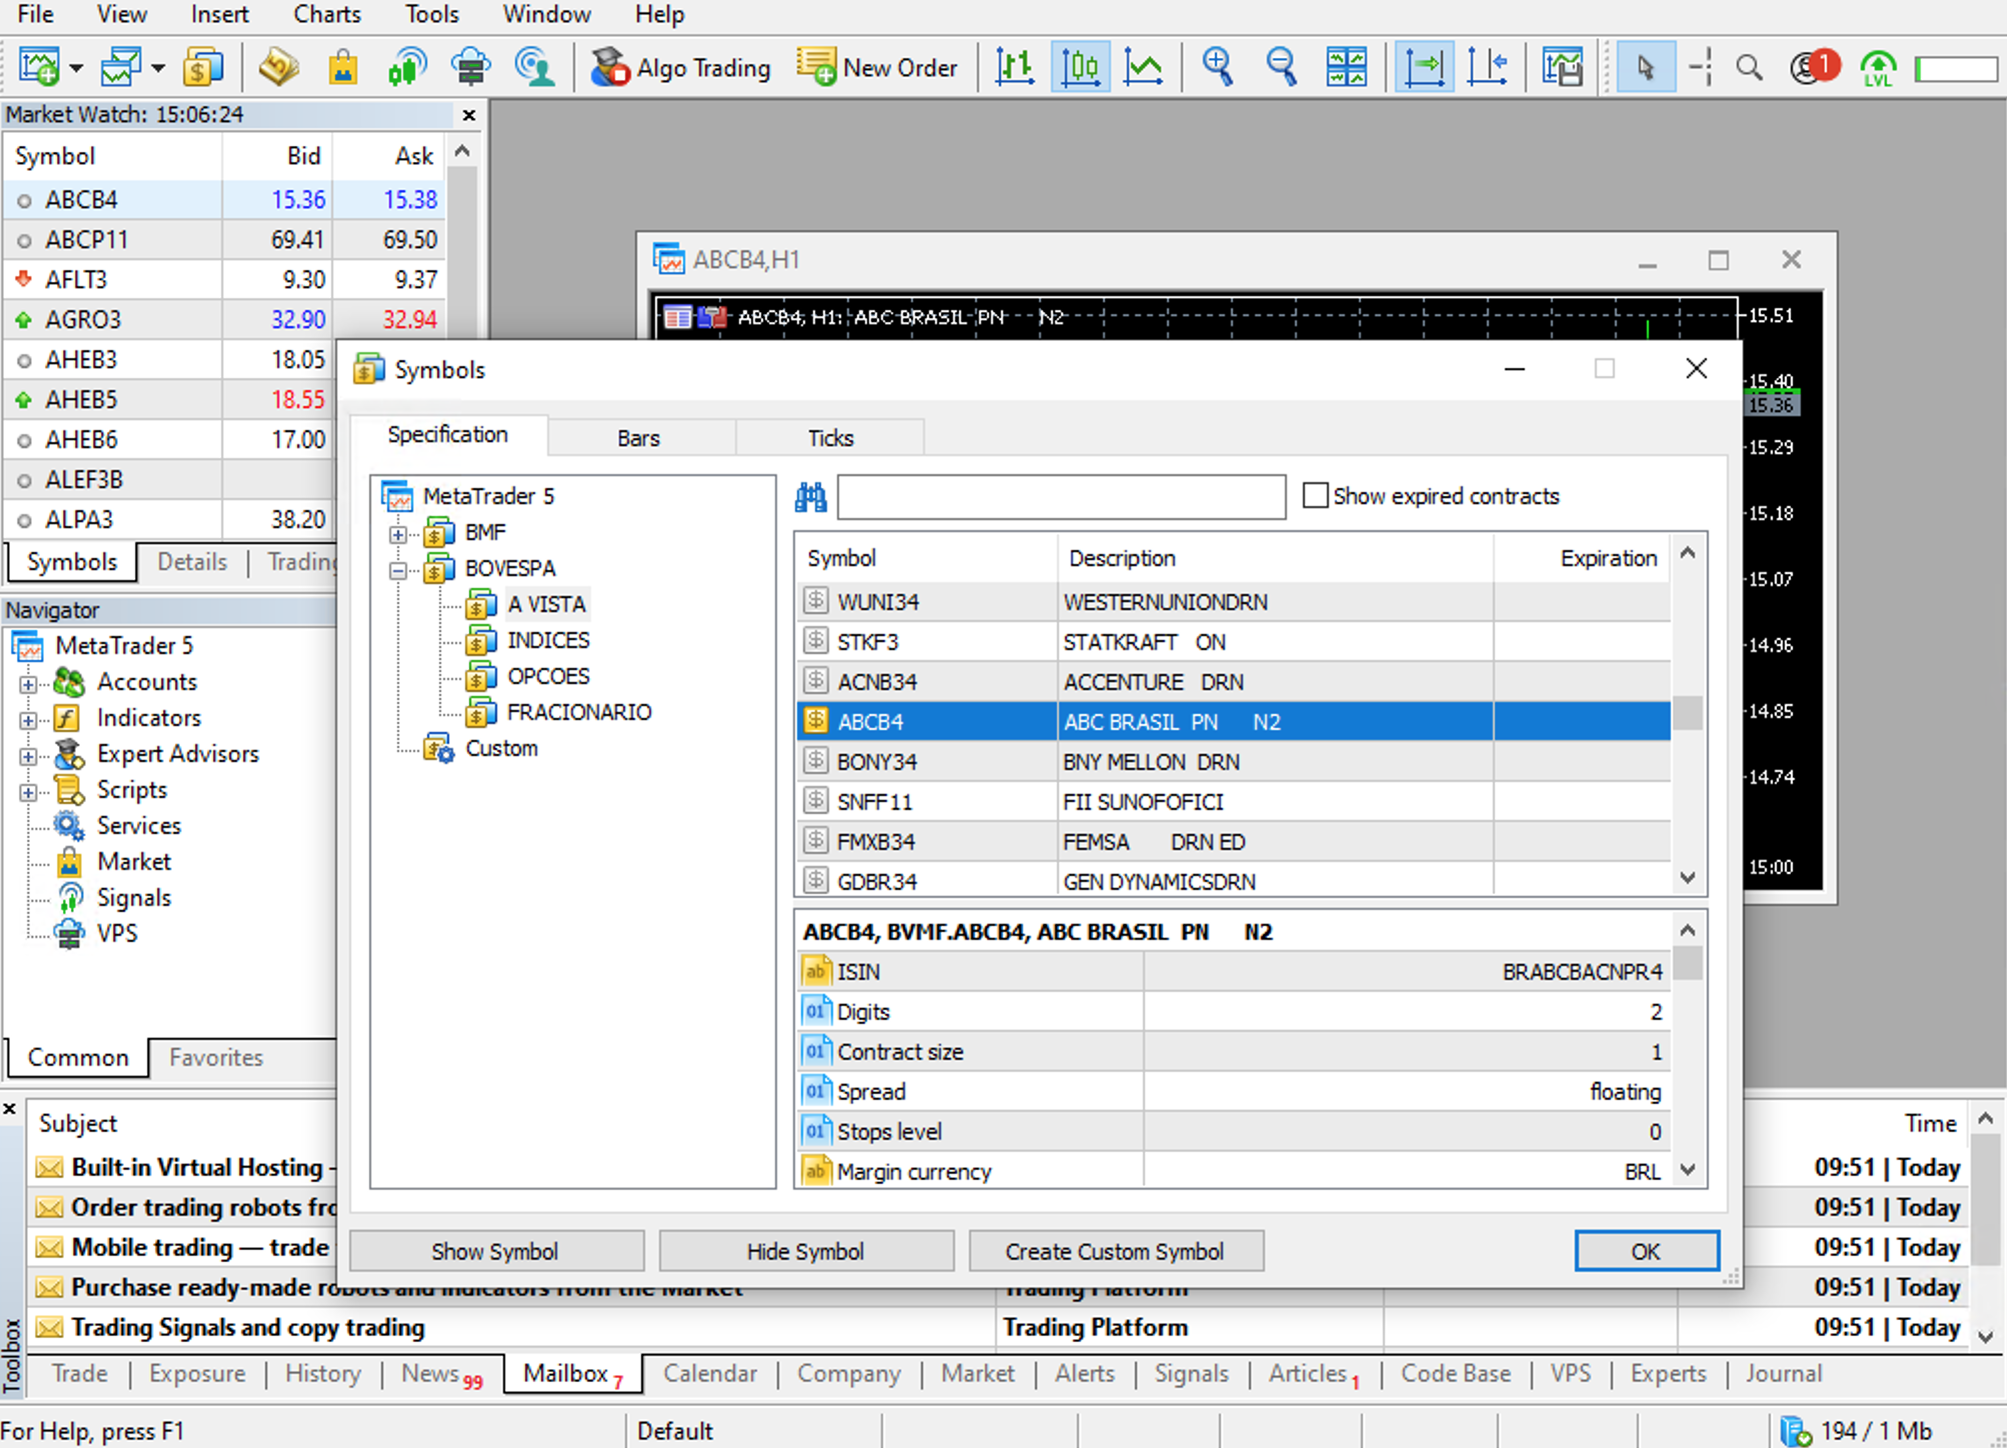
The “BMF” and “Bovespa” you see in that window are the names of two exchanges in Brazil (they’ve been merged into a single exchange called B3 but I guess MetaTrader is keeping the old names for now). You will see different names, depending on where your broker operates.
Say you’re interested in tick data. Just click on the Ticks tab, enter the ticker for the equity you want, and click Request. Here I am requesting tick data for BOVA11, an ETF that tracks Brazil’s main stock market index:
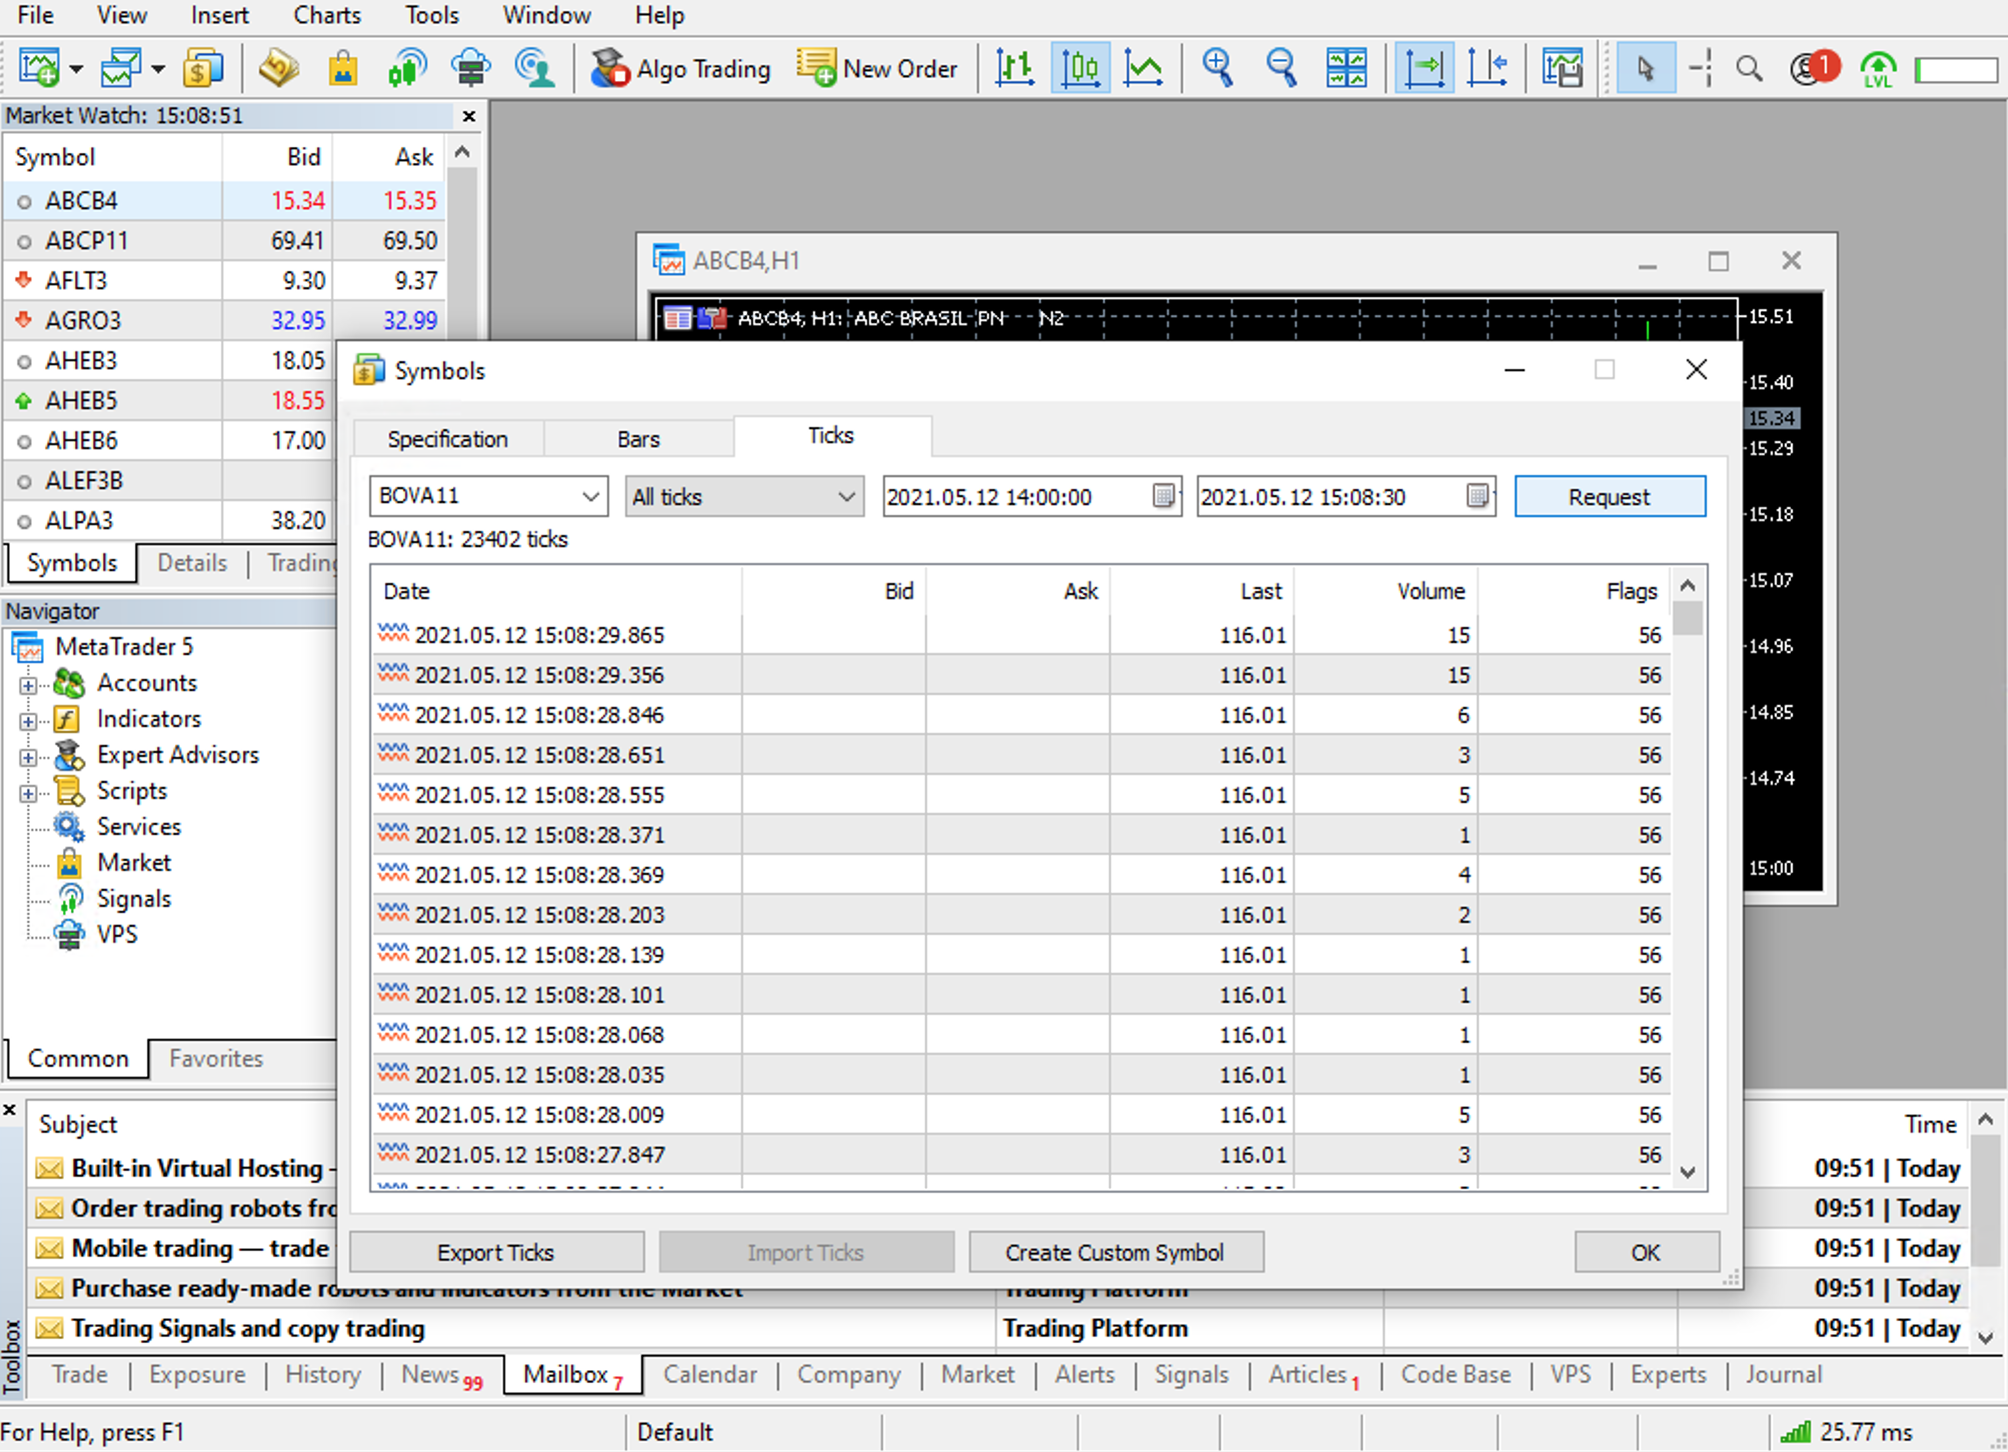
The Export Ticks button lets you save the data in a CSV format.
If you want time bars then go to the Bars tab instead.
The data you get depends on what your broker provides MetaTrader. I explored a bit and it looks like lower frequency data requests yield longer time series. When I request 1-minute BOVA11 bars I only get a year or so of data, but when I request 5- or 10-minute BOVA11 bars I get a few more years. That’s a far cry from the 13 years of data TickData sells, but for us DIY wannabe quants that’s enough to play around a bit. And, well, it costs zero dollars. (With TickData you’d need to pay US$ 6750 to access a single year of tick data from Brazil).
That’s all there is to it - if you are only interested in a couple of equities. But what if you want data for hundreds of equities? Or for all equities? Fortunately, MetaTrader has a nice Python API that you can access after pip installing the MetaTrader5 package.
Unfortunately, the MetaTrader5 package only works on Windows. If you want to use it on a macOS or Linux machine you’ll need Wine. I have access to a Windows machine so that wasn’t a problem for me.
Here is a minimal working example of how the Python API works. This snippet requests tick data (trade ticks only - no bid/ask ticks) for BOVA11 between 2021-01-01 and 2021-01-07 and then saves the results in a CSV file. Before you run this script you need to launch the MetaTrader app and log into it using the credentials your broker gave you.
import pandas as pd
import MetaTrader5 as mt5
from datetime import datetime, timedelta

# connect to MetaTrader 5
if not mt5.initialize():
    print('initialize() failed')
    mt5.shutdown()

# request tick data
ticks = mt5.copy_ticks_range(
    'BOVA11',
    datetime(2021, 1, 1),
    datetime(2021, 1, 7),
    mt5.COPY_TICKS_TRADE
    )
ticks = pd.DataFrame(ticks)
ticks.to_csv('BOVA11_ticks.csv', index = False)

# shut down connection to MetaTrader 5
mt5.shutdown()
If you want data for more equities just loop through the corresponding tickers. If that’s a lot of tickers there is a method symbols_get() that will return all tickers. For instance, the tickers for Brazilian ordinary stocks always have four letters followed by the number 3 - PETR3, HYPE3, etc. If you want only ordinary stocks you can use symbols_get() and then filter out any string that doesn’t have five characters or doesn’t end in 3.
One issue I’ve come across is that sometimes the API returns no data even though a manual search (using the GUI) shows that there is data. That doesn’t happen often but when it does it’s always with highly liquid equities, so I’m guessing if there is too much data to return you get nothing instead. So you may want to loop through shorter intervals - months instead of quarters, or weeks instead of months, or days instead of weeks, depending on how much data you’re requesting.
Another thing to keep in mind is that MetaTrader generates temp files for your requests and they are big as heck. It got to the point where my hard drive ran out of space. I had to use Python’s os to delete those temp files on-the-fly. They are saved to AppData/Roaming/MetaQuotes/Terminal/HASH/bases/BrokerID/ by default. If you want them to be saved elsewhere you have to move the MetaTrader installation folder to the new location and then execute it using cmd, with AlternateLocation/terminal64.exe /portable The temp files will be stored in AlternateLocation/Bases/BrokerID/
Here is a more complete example:
import os
import time
import calendar
import pandas as pd
import MetaTrader5 as mt5
from datetime import datetime, timedelta

# connect to MetaTrader 5
if not mt5.initialize():
    print('initialize() failed')
    mt5.shutdown()

# get connection status and parameters
print(mt5.terminal_info())

# get MetaTrader 5 version
print(mt5.version())

# path to CSVs
path_to_csvs = 'C:/Users/YourUserName/Desktop/ticks/'

# path to temp data (so we can delete it)
path_to_tmp = 'C:/Users/YourUserName/AppData/Roaming/MetaQuotes/Terminal/HASH/bases/BrokerID/'

# get all B3 tickers
symbols = mt5.symbols_get()

# keep only tickers for ordinary stocks
tickers = []
for symbol in symbols:
    ticker = symbol.name
    if not ticker[:4].isalpha():
        continue
    if (len(ticker) == 5) and (ticker[-1] == '3'):
        tickers.append(ticker)

# month-years to scrape
months = {
    2019: (10, 11, 12),
    2020: range(1, 13),
    2021: (1, 2, 3)
}

# loop through tickers
start = time.time()
for i, ticker in enumerate(tickers):

    # loop through month-years
    for year in months.keys():
        for month in months[year]:
            print(' ')
            print(i, 'of', len(tickers), ticker, year, month)

            # set date range
            t0 = datetime(year, month, 1)
            last_day = calendar.monthrange(year, month)[1]
            t1 = datetime(year, month, last_day)

            # request tick data
            ticks = mt5.copy_ticks_range(
                ticker,
                t0,
                t1,
                mt5.COPY_TICKS_TRADE
                )
            ticks = pd.DataFrame(ticks)

            # log if results are empty
            if ticks.shape[0] == 0:
                with open('log.txt', mode = 'a') as f:
                    l = ticker + ',' + str(year) + ',' + str(month) + '\n'
                    f.write(l)
                    print('empty DataFrame:', l)
                    continue

            # persist
            print(ticks.shape[0])
            ticks['time'] = pd.to_datetime(ticks['time'], unit = 's')
            ticks.columns = [
                'ticktime',
                'bid',
                'ask',
                'last',
                'volume',
                'time_msc',
                'flags',
                'volume_real'
                ]
            ticks.to_csv(path_to_csvs + ticker, index = False)

            # don't over-request
            time.sleep(2.5)

    # delete tmp files
    for fname in os.listdir(path_to_tmp + ticker + '/'):
        try:
            os.remove(path_to_tmp + ticker + '/' + fname)
        except:
            pass

    # how long did it take?
    elapsed = time.time() - start
    print('it took', round(elapsed / 60), 'minutes')

# shut down connection to MetaTrader 5
mt5.shutdown()
Finally, a word about the “flags” column (you can see it in the BOVA11 screenshot above). That column encodes a lot of information. For instance, it encodes whether the tick refers to a buy-initiated trade or to a sell-initiated trade. But it’s not as simple as “56 means buy-initiated” or anything like that. It took me some doing to learn how to interpret the flags. Turns out they are bit masks. To extract the information encoded in each flag you need to do a bunch of bitwise operations. For instance, to tell whether a given tick represents a buy- or sell-initiated trade you need to pass the flag through a function like this:
def buy_or_sell(flag):
    '''
    see https://www.mql5.com/en/forum/75268
    for explanation on MetaTrader flags
    '''
    if (flag & 32) and (flag & 64):
        return 'both'
    elif flag & 32:
        return 'buy'
    elif flag & 64:
        return 'sell'
MetaTrader uses 32 to encode “buy-initiated” and 64 to encode “sell-initiated”. Say the flag for a given tick is 56. The bitwise operation 56 AND 64 returns 0. That means the tick does not refer to a sell-initiated trade. But the bitwise operation 56 AND 32 returns 32. That means the tick refers to a buy-initiated trade. (In some rare cases the tick refers to a trade that was simultaneously initiated by buyer and seller.) The flag 212, on the other hand, returns opposite results: 212 AND 32 returns 0 and 212 AND 64 returns 64 - in other words, a tick with the flag 212 refers to a sell-initiated trade.
Here is information on everything else that each flag encodes.
This is it. Let me know if there are other sources of intraday data I should check out. What are the cool kids using?